ENGLISH

7卷/2期

7卷/2期

華藝線上圖書館

Pages:

3-22

論文名稱

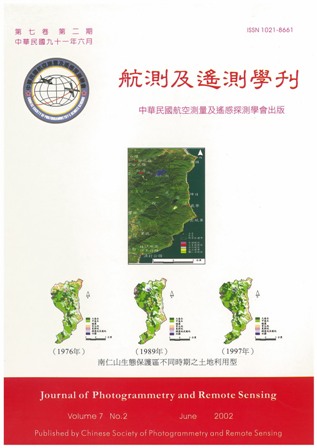
結合航測資訊與地景指數探討南仁山生態保護區之干擾因子

Title

Using Areial Photos Data and Shannon Di­ versity Index to Study on the Disturbed Factors of the Nanjenshan Ecological Rreserve

作者

吳守從 , 陳永寬

Author

Shou-Tsung Wu , Yeong-Kuan Chen

中文摘要

生態體系具有動態變化之特性,因此了解其變遷過程以制定適當的保育政策,為維持整個生態系統生物多樣性的基礎;然森林生態系係由林中之動物、植物及其生存之環境所共同組成,故其發展自必有干擾因子存在,而探討此等干擾因子之作用程度與影響範圍,又當為研究森林生態系變遷及經營管理所不容忽視之重要課題。 本研究首先整理前人研究結果與現場調查資料以研判影響南仁山生態保護區植群社會發展之機制;次將南仁山區域 1976、1989、1997三年度航空照片判釋、分類、數化、建檔後,以 Shannon 多樣性指數探究各影響機制干擾區與非干擾區之地景生態系統變化,並藉由 t 測驗檢定其間差異;最後由檢測結果探討該保護區經營管理之相關課題。 研究結果顯示,水份因子、東北季風等自然因素,以及道路開發、人工造林、邊緣效應等人為因素,均確實為影響南仁山生態保護區植群社會發展之機制,而由地景變遷之t檢定結果顯示,保護區之成立對於不同干擾因子之效用並不相同。就經營管理面而言,影響其生態體系發展的天然因素長久以來便已存在,當可視為一恆定之常態因素,故其因應之道僅需避免對脆弱地帶造成破壞即可;而人為干擾則需視干擾程度與影響範圍之不同分別研擬經營策略。

Abstract

A dynamic ecosystem is compose of animal, plant, and environment. In order to keep the biodiversity and make the strategy of management, it is essential for understanding vegetation succession. In a dynamic ecosystem, there are many disturbed factors, so to know where and how they work is the most important thing for understanding vegetation succession. In this study, disturbed factors of vegetation society are decided by references and survey data, land cover types at Nanjenshan ecological reserve were interpreted from aerial photos of 1976, 1989, and 1997. Those classified digital data were used to derive Shannon diversity index for mining the dynamics change of land­scape ecosystem in different disturbed factor. T-test was applied to detect the landscape differentiability between every two periods. Results of this study show that the moisture, northeaster monsoon, road establishment, afforestation, and human exploitation are actually the disturbed factors of vegetation society. The Nanjenshan ecological reserve is effective in tending to a stable high-density forest vegetation society, but the administrative department should make proper starages for the distubed factors individually.

關鍵字

地景指數、生態變遷、地理資訊系統、航測資訊

Keywords

Shannon diversity index, landscape change, GIS, aerial photo data

附件檔名

華芸線上圖書館

N / A

備註說明

200206-7-2-3-22

Pages:

23-38

論文名稱

地理資訊系統於植群生態指數分析之應用

Title

Application of GIS in Analysis of Vegetation Ecological Indices

作者

詹進發

Author

Jihn-Fa Jan

中文摘要

植群生態指數之建立旨在瞭解植物社會之生態歧異性、生育地環境、林分構造。本研究利用全球衛星定位系統測量設置於自然保護區之永久樣區的基點位置,並逐一量測樣木相對於樣區基點之座標值,以及林木生育地環境因子如:海拔高度、坡度、方位角等。野外調查資料利用地理資訊系統建置植物資源地理資料庫,經由座標轉換計算樣區與樣木位置之絕對座標值,並自動產生樣區與樣木位置主題圖層,以便與其他基本圖套疊。此外,並建立植群生態指數分析模式,分析植群之優勢度指數、種類豐富度指數、歧異度指數、均勻度指數與重要值指數。研究結果顯示,地理資訊系統不僅可以有效管理植物資源地理資料庫與提昇資料品質,並可隨時依分析者之目的需求篩選樣區與樣木,迅速分析植群之生態指數。植群生態指數分析結果有助於瞭解自然保護區之生態環境變遷與植群演替過程,可供自然保護區經營管理之參考。

Abstract

Vegetation ecological indices are useful for understanding the ecological diversity, physical environment, and stand structure of vegetation. This research utilized global positioning system to measure the coordinates of the base points of permanent plots designated in nature reserves. Furthermore, the locations of sample trees within the plots, slope, aspect, and several physical environmental factors of the plots were measured. Geographic information system was applied to establish a geographic database for vegetative resources using field data. The absolute coordinates of plots and sample trees were calculated by using coordinates transformation, and the thematic maps of plots and sample trees were generated automatically from the data. In addition, a vegetation ecological indices analysis model was implemented to derive a number of ecological indices of vegetation, which includes index of dominance, species richness index, index of diversity, evenness index, and important value index (IVI). The results show that GIS is very effective in managing geographic database of vegetation and improving the data quality. Using GIS, the analyst can dynamically select sample plots and rapidly derive various ecological indices of the vegetation. The results of vegetation ecology analysis are useful for understanding the environmental changes and the processes of ecological succession within nature reserves.

關鍵字

地理資訊系統、植群生態指數、自然保護區

Keywords

geographic information system (GIS), vegetation ecological index, nature reserve

附件檔名

華芸線上圖書館

N / A

備註說明

200206-7-2-23-38

Pages:

39-60

論文名稱

利用 GIS 技術評估嘉義林區國有林對降水的年粗涵養量之研究

Title

Using GIS Technique to Investigate the An­nual Gross Quantity of the Forest Preserved Water with the Case of Chiayi Area

作者

林金樹 , 陳峰盛 , 劉正川

Author

Chinsu Lin , Feng-Sheng Chen , Jeng-Chuan Liou

中文摘要

本研究以ArcGIS 地理資訊系統為工具,依據經濟部水利局所轄的雨量與流量資料,以空間統計學方法分析推導嘉義林區全區的降雨量與年粗涵養量,目的在瞭解林區對降水的涵養能力,以供未來實施林區林地分級研究之應用。研究結果顯示,嘉義林區之阿里山、玉山、大埔以及玉井等四個事業區主要分佈於曾文溪、曾文水庫、荖濃溪、清水溪、旗山溪、陳有蘭溪、八掌溪以及急水溪等主要集水區內。在 1999 年當中,該等集水區每平方公尺單位面積的年平均降雨量在160 mm 以上。阿里山、玉山、大埔以及玉井等四個事業區對 1999 年降雨的年粗涵養率各為 38.61%、21.25%、31.70% 以及 65.81%。嘉義林區對降水的年粗涵養量具有波浪型態的變化特徵,在五月至八月的豐雨期間,森林或集水區對降水的年租涵養量最高,隨著晚秋、冬季以致春季其年粗涵養量逐步下降,然後再向上升。

Abstract

This study applied the geostatistically ordinary Kriging algorithm to predict the spatially rainfall distribution of Chiayi forest area. It aims to know the rainfal1 amount that is annually kept by the forest area for purposes of forestland classification. Quantity of annually gross holdback (AGH) was defined by sub­tracting the discharge quantity from the rainfall. The data used in this study were supplied by the Water Resources Agency, Ministry of Economic Affairs; and were analyzed by the GIS software ArcGIS. Results showed that the Chaiyi forest area was wide located on several watersheds, such as Tseng-Wen Chi, Tseng­Wen Dam, Lao-Nung Chi, Ching-Chui Chi, Chi-San Chi, Cheng-You-Lan Chi, Pa-Chang Chi, and Chi-Shui Chi. In 1999, the mean annually rainfall of these watershed are more than 160 mm and the gross ratio of rainfall keeping of each working circle of Chaiyi forest area, i.e., Alishan, Yushan, Dapu, and Yuchin, is 38.61%, 21.25%, 31.70%, and 65.81% respectively. The AGH by the forest area and watershed is varying in a waveform corresponding with the serial month changing. Most of the positively AGH is happened from May to August, after that AGH is smoothly come down to negative until next May.
關鍵字

地理資訊系統、降雨量、粗涵養量、克利金內插法、空間統計學

Keywords

GIS, Rainfall, Gross holdback, Kriging interpolation method, Geostatistics

附件檔名

華芸線上圖書館

N / A

備註說明

200206-7-2-39-60

Pages:

61-74

論文名稱

應用 GIS 及 Logit 模式分析六龜地區林地變遷

Title

Analyzing Forestland Changes of the Liukuei Area Using GIS and Logit Models

作者

許立達 , 鄭祈全

Author

Li-Ta Hsu , Chi-Chuan Cheng

中文摘要

本研究以高雄縣六龜地區為研究區域,蒐集當地土地利用之歷史變遷與當地環境及社會經濟等資料,建立地理資料庫,並以 logit模式分析林地變遷的影響因子。比較六龜地區 1977及1994 年土地利用的情況,發現期間的主要變遷為農地回復為林地,但亦有部份林地被變更成為農地。分析結果顯示海拔低、坡度平緩、距道路近的地區較容易被開發為農地,而村中的農牧戶數愈多,林地被開發的可能性也更高。反之,海拔高、坡度陡的農地則較容易被放棄農用而回復為林地,而村中的農牧人口數愈少,農地回復為林地的可能性也更高。

Abstract

This study took the Liukuei area of Kaohsiung County as the study area. Data on historic land uses, as well as the environmental and socioeconomic conditions of the study area were collected to develop a GIS database, and logit models were used to examine the possible factors contributing to the observed forestland changes. Comparisons of the land use conditions of Liukuei area in 1977 and 1994 showed that the major change during the period was the recovery of forestlands from farmlands. However, some of the forestlands were also converted into farmlands during the same time. Results of the logit models showed that forestlands located at lower elevation, without steep slope, and in the proximity of roads were more likely to be converted into farmlands. The probabilities were further increased at villages having more agri­cultural families. On the other hand, farmlands located at higher elevation, with steeper slope, and at villages having fewer farmers were more likely to be abandoned or reforested.

關鍵字

六龜、林地、土地利用、logiy模式

Keywords

Liukuei, Forestland, Land use, Logit model

附件檔名

華芸線上圖書館

N / A

備註說明

200206-7-2-61-74

Pages:

75-86

論文名稱

NOAA 衛星資料預測氣象乾旱之可行性研究

Title

Feasibility Study on Prediction of Drought Weather ßased on NOAA Satellite Data

作者

陳朝圳 , 李錦育 , 楊剛

Author

Chaur-Tzuhn Chen , Ching-Yuh Lee , G.. Yang

中文摘要

利用歷年來高屏地區氣象站之觀測資料,及農政單位所公佈之旱災災情資料,建立旱災災情資料庫;利用時間序列 ARIMA,建立降雨量之時間序列模式;另以 1998~2000年之每週NOAA 衛星影像資料,計算乾旱指標(Drought Index,DI),利用三年間之乾旱資料,配合降雨量時間序列模式,分別探討植生在乾旱情況下,乾旱指標之時間變化為了解不同乾旱狀態下,植物光譜反射特性之差異,本研究以甘蔗及甘藷二種作物為材料,利用光譜儀,探討不乾旱狀態下,植物之光譜反射特性。結果顯示以 NOAA 衛星所計算之乾旱指標,於植物缺水三個月後,才會呈現顯著的差異;乾旱指標與降雨量之季節呈顯著相關,顯示當乾旱發生時,NOAA 衛星影像可敏感反映乾旱的危害程度,而由控制試驗亦證明作物在不同乾旱狀況下,其葉部之光譜反射特性具有顯著性差異。本研究所建立之氣象乾旱年、月循環變化資訊,為未來建立乾旱監測系統之重要工作。

Abstract

A drought database has been established based on accumulated data of the Kao-Ping Meteorological Station and drought information published by the agricultural administrative agencies. A time-series analysis model, ARIMA, was used in rainfall time series analysis of the data. Two commonly seen crops of the area, sweet potatoes and sugar cane were selected for study of ref1ection spectrum variation due to the prevailing weather condition, more specifically by draught. A preliminary result showed that the drought indexes calculated from NOAA satellite images had responded to the water deficiency started 3 months ago. The drought index and seasonal variation of precipitation are highly correlated. When the drought started, NOAA crops image sensitively ref1ect different degree of drought danger. A controlled experimentation had also proved that characteristics of spectrum crop leaves ref1ected had significant differences between different moisture conditions. Drought cycles by years and by months derived from past meteoro­logical data in this study may be a valuable reference to the future drought monitoring system.

關鍵字

時間序列、乾旱指標、NOAA衛星

Keywords

Time-series, Drought Index, NOAA satel1ite

附件檔名

華芸線上圖書館

N / A

備註說明

200206-7-2-75-86

Pages:

87-96

論文名稱

整合 NOAA-AVHRR 影像與地理資訊系統監測森林火災之研究

Title

Study on Integrate NOAA-AVHRR Image and Geographic Information System to monitor forest fire

作者

鍾玉龍 , 陳正華

Author

Yuh-Lurng Chung , Cheng-Hua Chen

中文摘要

森林火災對自然生態環境以及人穎的生命財產安全均造成嚴重的影響,一旦林火延燒未能即時撲滅,非但林木遭受焚毀,且林地頓失覆蓋,喪失了水土保持功能,進而影響國土保安,顯見森林火災之影響極為深遠。為了能更有效率及確實掌握森林火災的資訊,本研究以 NOAA­AVHRR影像,計算 NDVI (Normalized Difference Vegetation Index)以比對森林火災對植生之影響,並以熱紅外光波段評估森林火災範圍,其結果有助於經營管理單位獲得即時林火資訊,俾能迅速撲滅林火。

Abstract

Forest fire can cause serious damage to the ecological environment and human lives and property. Once the fire does not be put off in time, the trees are destroyed and the land loses its cover, this affects soil & water conservation. In order to obtain the information about forest fire more efficiently and correctly, this research is based on NOAA-AVHRR to derivative the NDVI (Normalized Difference Vegetation Index) and from the variation of NDVI reveals the impact of forest fire on vegetation. Auxiliary the digital number on thermal-IR band, the high probability location of forest fire can be delimited. The result can help the manager in obtaining forest fire information and thus hopefully forest fire can be put off as soon as possible.

關鍵字

NOAA-AVHRR 影像、地理資訊系統、植生指標、森林火災

Keywords

NOAA-AVHRR image, Geographic information system, Vegetation index, Forest fire

附件檔名

華芸線上圖書館

N / A

備註說明

200206-7-2-87-96

更多活動學刊